Illegal work in the UK
This mini-project examines how illegal working in the UK is represented in BBC News reporting, with a focus on identifying the employment sectors most frequently associated with such cases. Using a corpus of BBC News articles, the project applies digital methods introduced in the second part of the course, including web scraping, corpus cleaning, keyword-based text analysis, geographic data extraction, and data visualisation. Through this process, I learned how to transform unstructured news texts into structured datasets, address methodological challenges such as duplicate counts and geographic inconsistencies, and critically reflect on the limits of automated analysis. The project demonstrates how computational approaches can support systematic and reproducible analysis of media discourse and provides a foundation for more detailed investigation in later stages of my research.
Research Question
One of the key components of this mini project was developing a clear research question that aligned with my thesis statement. This proved challenging, as I was required to focus on only one specific aspect of the thesis at an early stage, before I had fully developed the thesis itself or gathered sufficient background information. Throughout the project, I revised my research question several times as my understanding of the data and the scope of the project evolved. I found that some earlier versions of the question did not align well with the corpus I had collected, which required me to rethink and refine my approach. For example, I initially considered focusing on London but ultimately changed the scope to the UK. This adjustment allowed for more data and made the analysis geographically comparable through geographic data from the BBC navigation table. As a result, I developed a final research question that more accurately reflects both the available data and the aims of the analysis. The final research question for this project is:
Which employment sectors are most frequently associated with illegal working in the UK according to BBC News reporting?
Context of Research
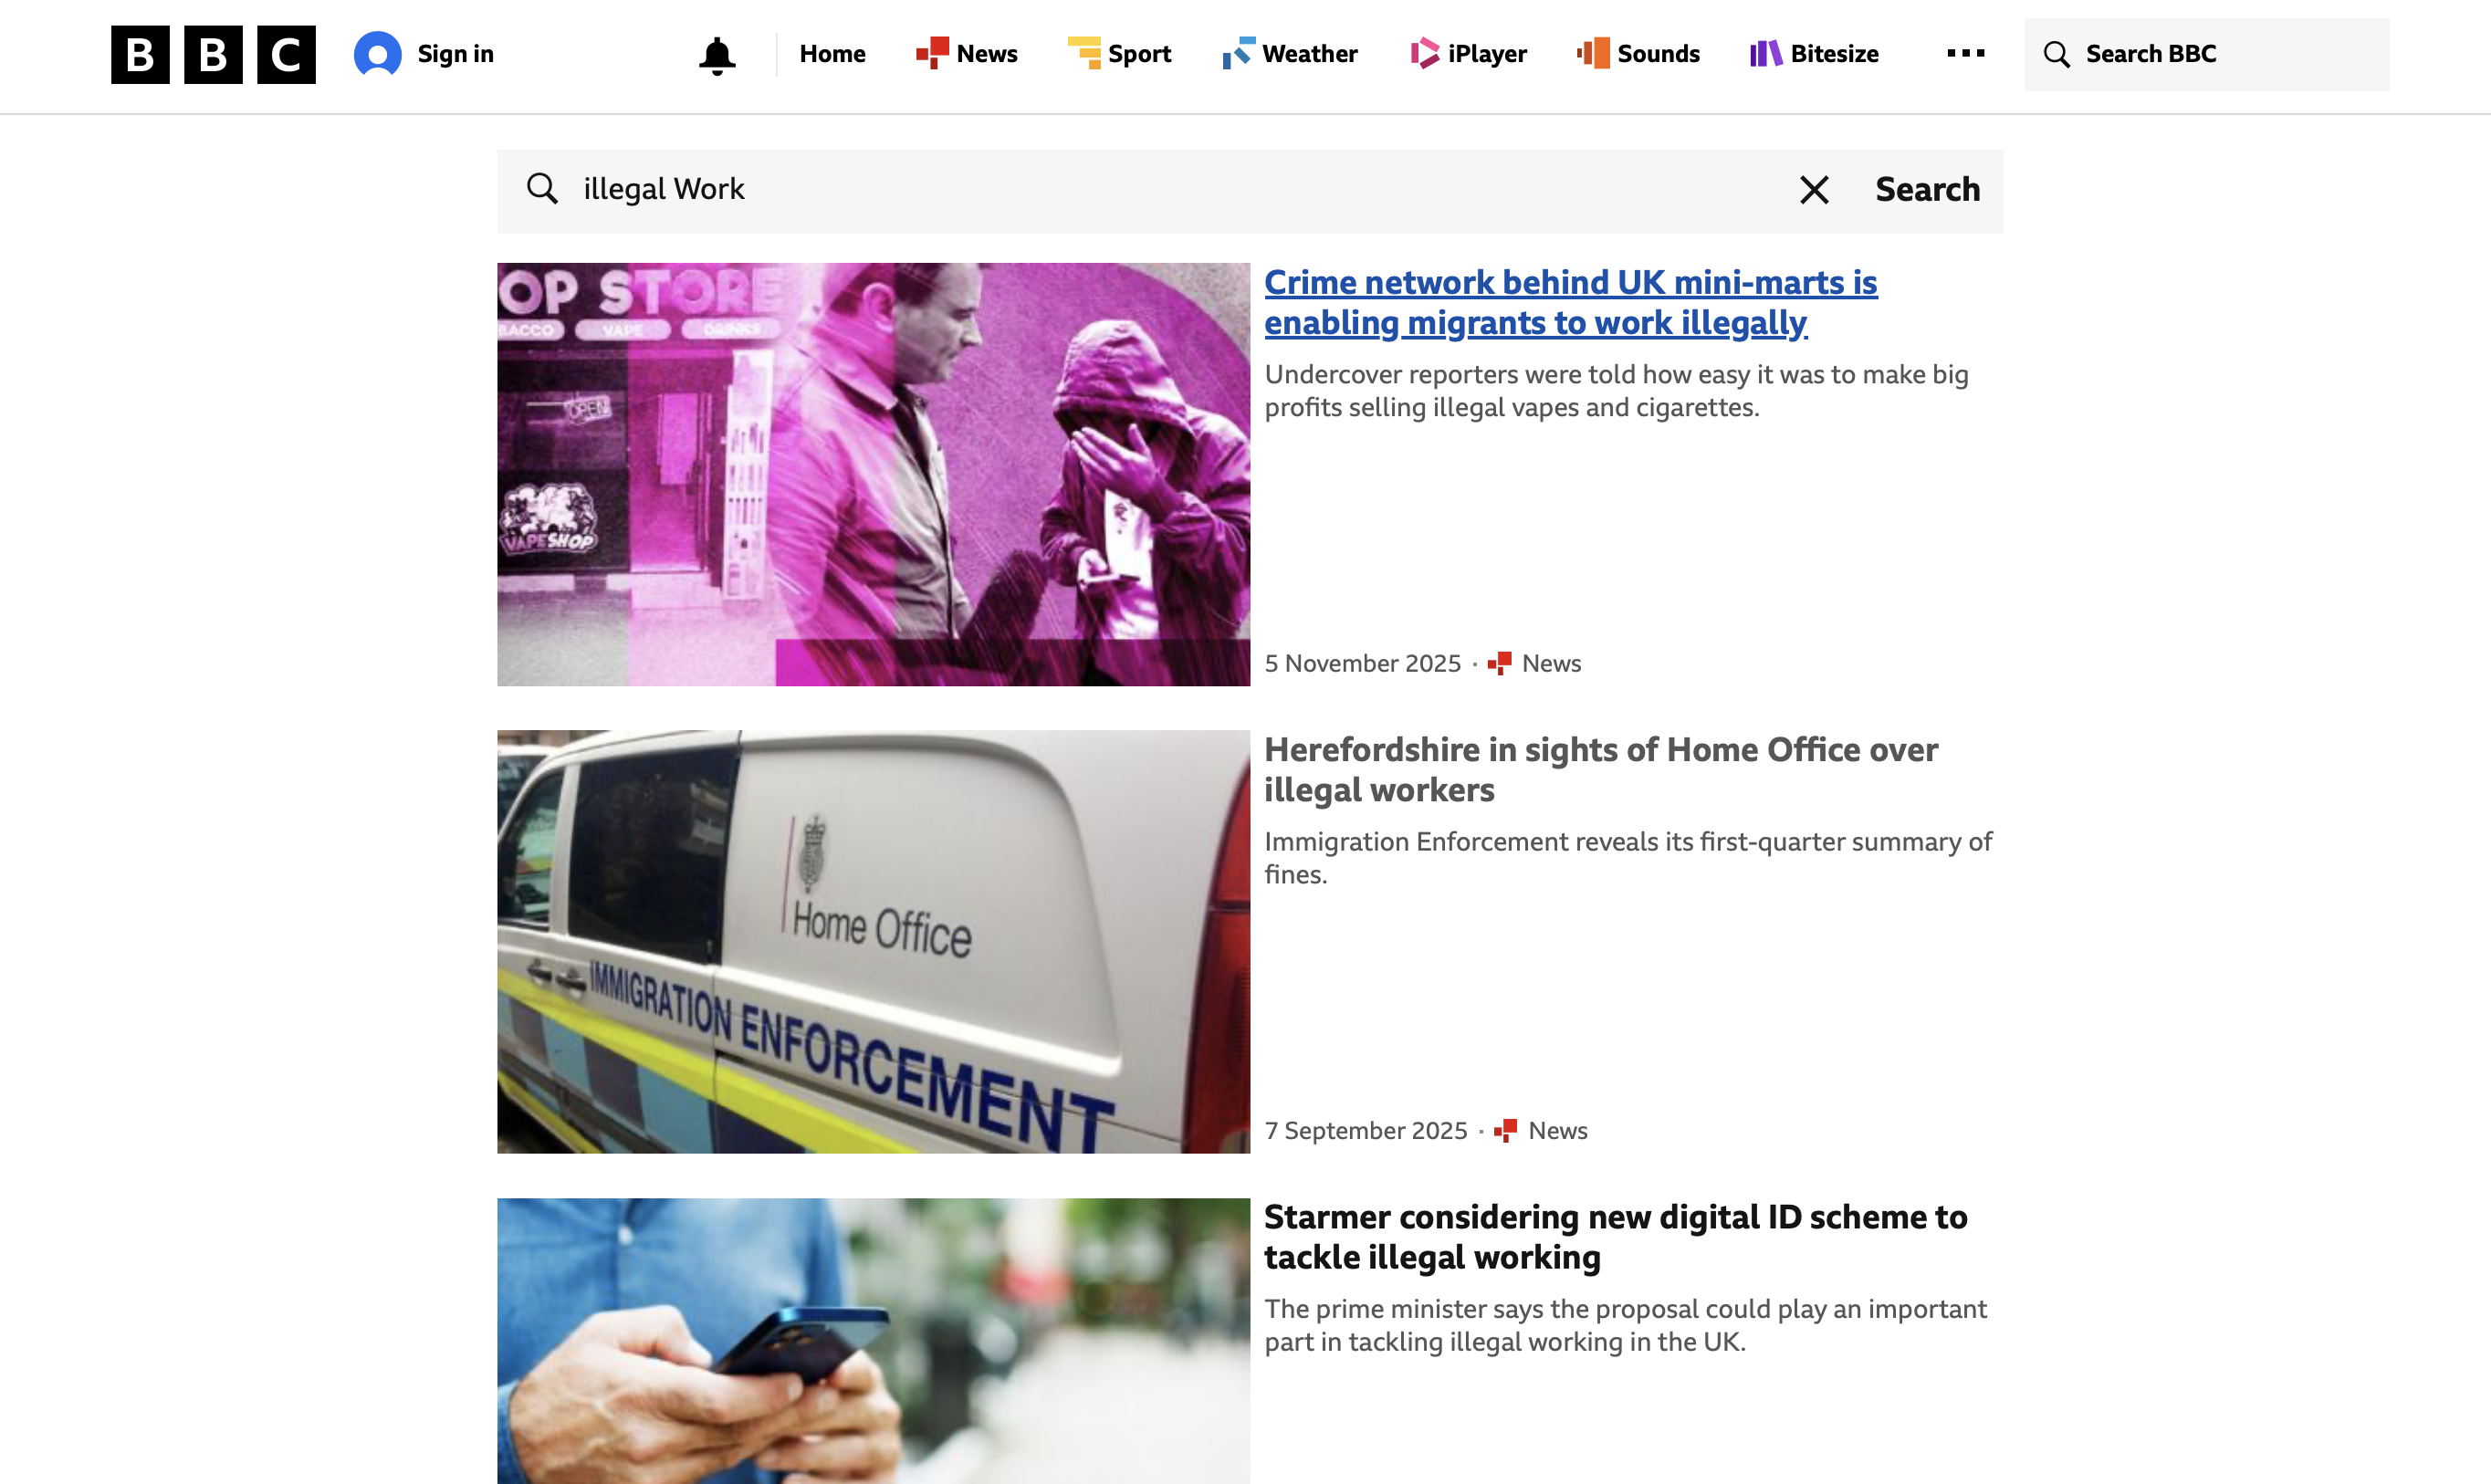
This mini-project focuses on the issue of illegal working in the UK and examines it exclusively through BBC News reports. Although I initially considered including additional news sources such as The Guardian and The Times, these were ultimately excluded because they often report on the same cases, which could result in overlapping data. This topic is particularly meaningful to me not only because it forms part of my thesis, but also because I have been living in the UK for over a year and have encountered situations related to illegal employment. These personal experiences motivated me to explore how people find illegal work and how such cases are represented in the media. Analysing BBC News reports allows me to examine this issue from a specific media perspective. In the later stages of my thesis, I plan to conduct interviews, which will provide insight into real-life experiences of illegal working. Comparing these first-hand accounts with how illegal work is reported in the media is especially interesting, as it allows for a critical examination of the differences and similarities between media narratives and lived realities. Moreover, the topic is closely connected to everyday social challenges that many people currently face.
Corpus I gathered
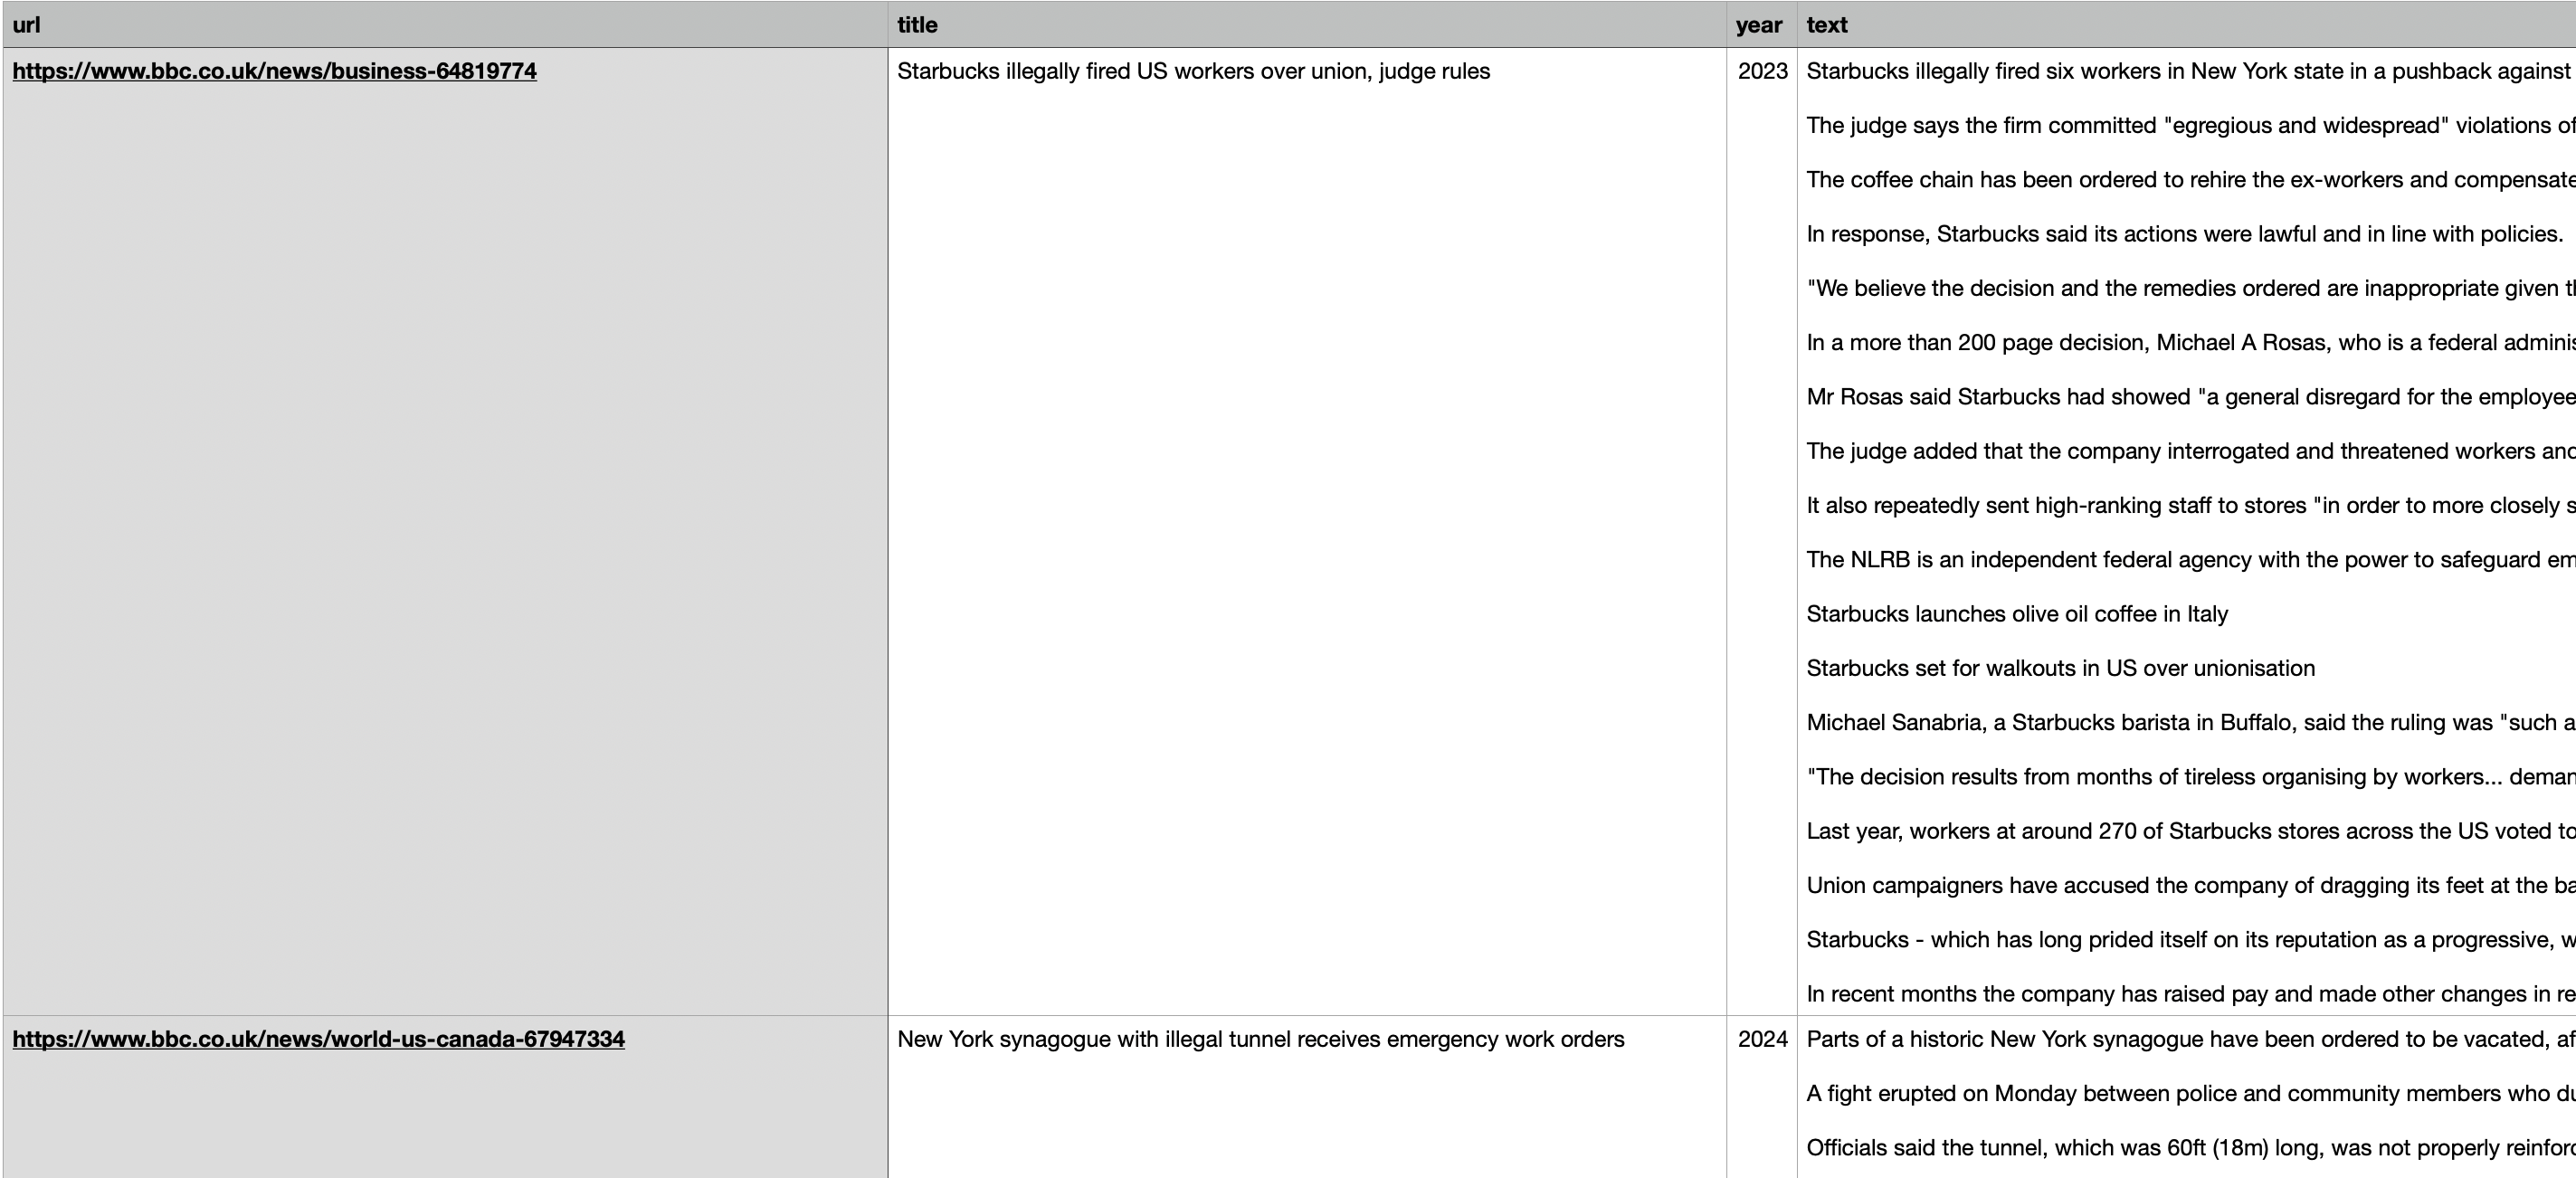
Creating the corpus for my mini-project was a central stage of the analysis, as the overall quality of the project depends on how accurately the corpus aligns with the research question. I collected data from BBC News articles published between 2000 and 2025 and organised them in a structured table containing the article URL, title, publication date, and full text. This structure allowed me to systematically manage and analyse the data while maintaining consistency across the corpus. A good practice I followed throughout the project was progressively updating the CSV file as new layers of analysis were completed. For instance, the first clean CSV file contained only the article text, heading, date, URL, and year. Once I applied keyword tagging to identify employment sectors, I added this information as an additional column. Later, when I extracted geographic data at both local and large-region levels, these were incorporated as further columns. This progressive updating of the CSV created a clear workflow and allowed the project to build iteratively, with each stage enriching the dataset for subsequent analysis.
One of the main challenges I encountered during corpus construction was the presence of non-textual and extraneous elements within BBC News articles, such as advertisements, embedded links, and navigation content. In addition, some articles included titles, image captions, publication dates, and navigation links within the main body of the text. To address this, I conducted HTML inspection and parsing and extracted only the relevant <p> tags in order to isolate the main article content. This cleaning process was essential to ensure that the corpus reflected the actual journalistic text rather than surrounding website elements.
During the initial data collection process, I noticed that the corpus was heavily biased towards more recent articles. This bias was caused by the BBC search engine, which prioritises newer content in its search results. To reduce this imbalance, I revised my scraping approach by performing separate searches for each individual year between 2000 and 2025, rather than relying on a single broad date range. Iterating through each year allowed me to retrieve a greater number of older articles and resulted in a more balanced dataset that was better suited for time-series analysis.
Despite these adjustments, the corpus has some limitations. Although the intended time span was from 2000 to 2025, the earliest articles retrieved date from approximately 2010, reflecting limitations in the availability and indexing of older BBC News content. Additionally, I treated data from 2025 with caution, as the year is not yet complete and may give the impression of an increased volume of reporting. Acknowledging these limitations is important when interpreting temporal patterns in the analysis.
Reflecting on the Analysis
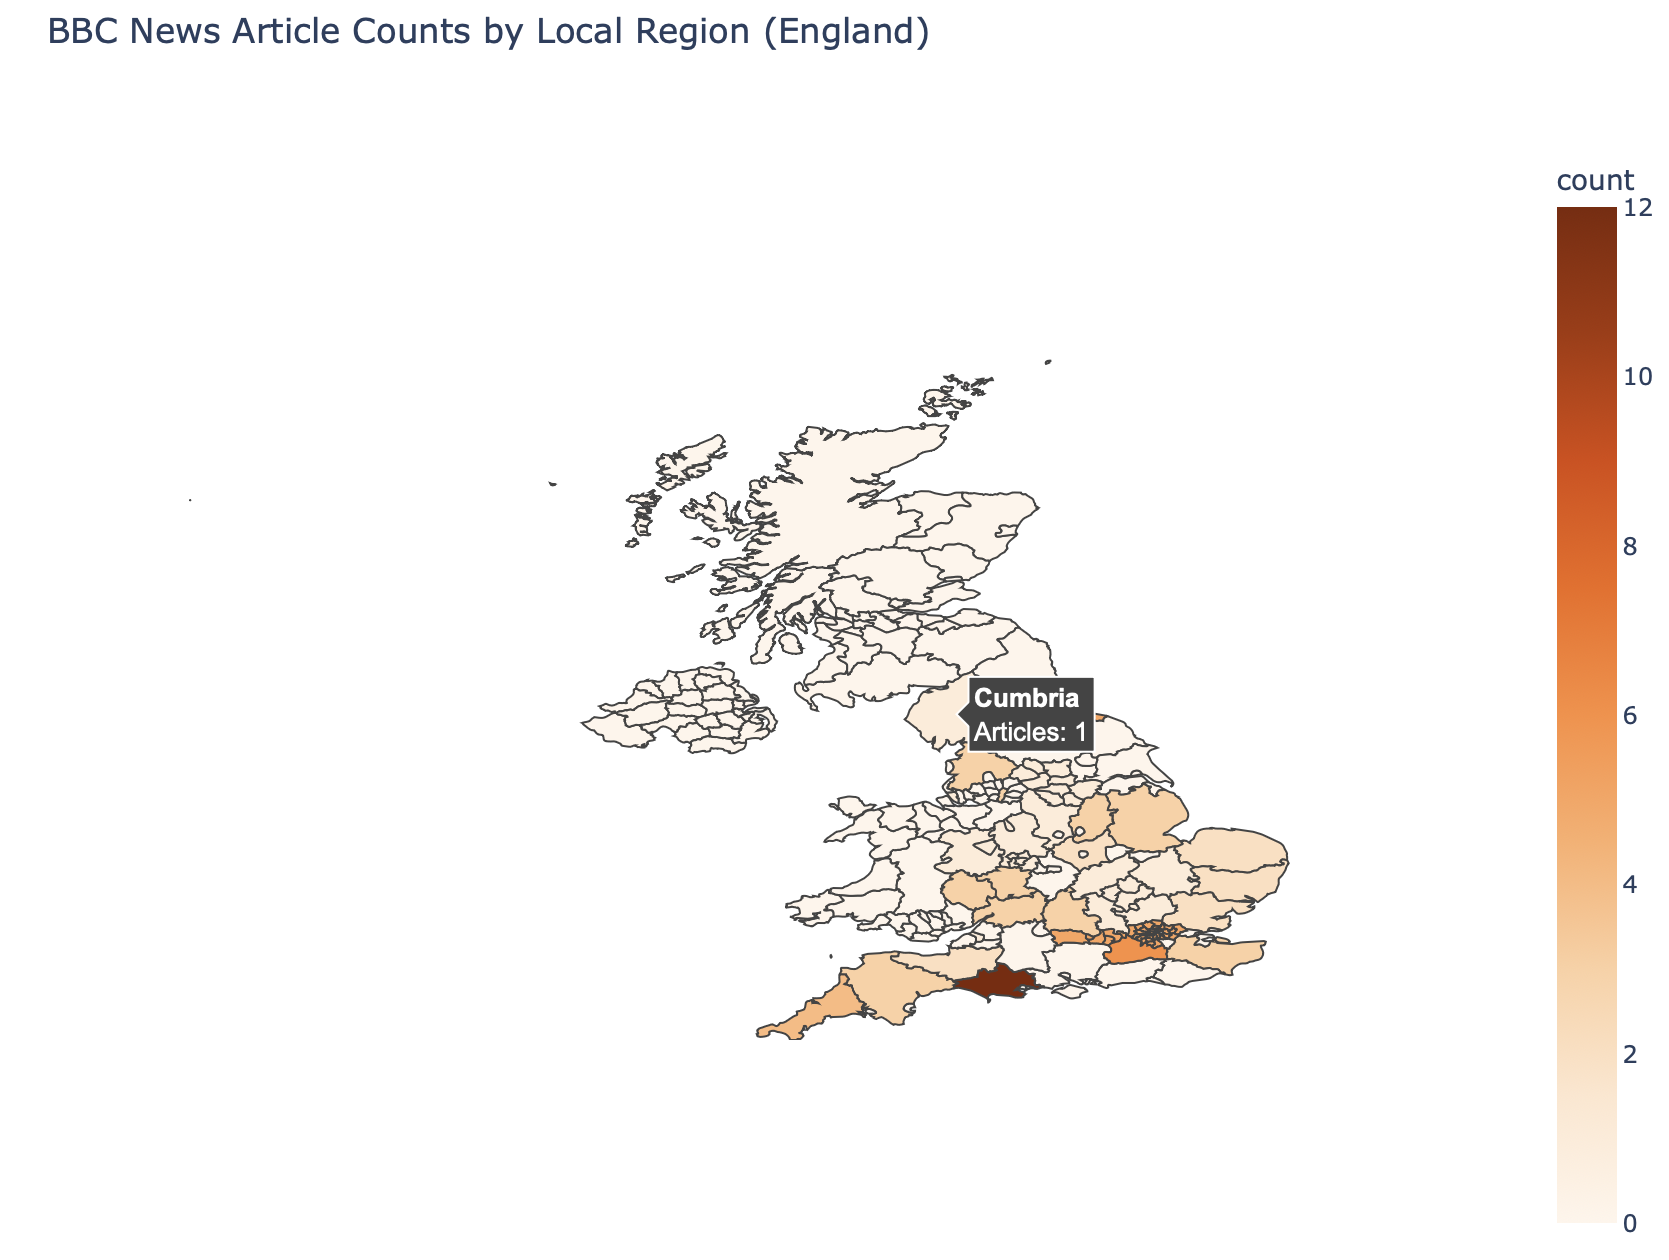
I initially collected BBC News articles using the BBC search engine and filtered them to UK-only articles using explicit category links. I then attempted to extract geographic information from the global navigation menus, but this proved unreliable because the menus are identical across articles. Through HTML inspection, I discovered that BBC stores article-specific geographic information in breadcrumb-style navigation links within the BBC News navigation bar. I therefore revised my approach to extract large and local regions by identifying links beginning with /news/england, /news/scotland, etc., within this navigation. This method accurately captures both national and sub-regional locations and is consistent, scalable, and suitable for quantitative geographic analysis. I also attempted to translate this geographic data into a choropleth map, focusing on smaller regions within England. However, this process faced challenges: the GeoJSON data available for administrative territories in England does not seamlessly match the regions mentioned in BBC articles, often requiring manual geocoding. For example, London, as referenced in the BBC navigation table, is not readily represented as a single administrative unit in the available GeoJSON data. To address this, I manually aggregated the GeoJSON of various smaller regions to create a composite GeoJSON representing the larger area of London.
 Click here for the interactive map
Outlining my Findings
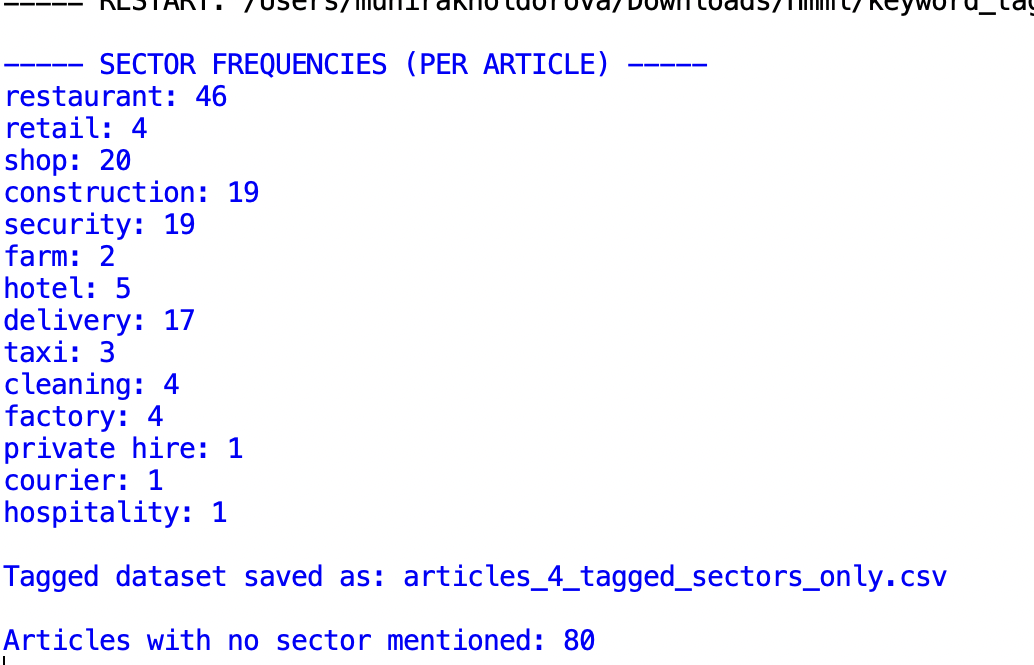
After compiling my corpus, I used keyword tagging to analyse how many illegal workers in the UK were reported in different employment sectors. A key challenge I encountered was that a single article could reference the same sector multiple times, which would artificially inflate the counts and give a false impression of more cases. To address this, I implemented a code that prevented a sector from being counted more than once per article, ensuring that each article contributed only one case to the analysis. Based on these corrected counts, the restaurant sector had the highest number of cases, with 46 mentions, followed by shops with 20. Construction and security each had 19, delivery had 17, and all other sectors had fewer than 5 mentions.
I visualized these results using Loliport, which proved convenient because it made the differences between sectors easier to interpret.
Click here for the interactive Lolipop
I did not use OpenAI for categorizing employment sectors because it is inconsistent, sometimes invents sectors, and is unreliable for accurate counting; instead, I used keyword tagging, which relies on fixed category names and produces more consistent and reproducible results.
The line graph shows the number of BBC News articles on illegal working in the UK from 2010 to 2024. Each year is represented with a marker and the exact article count is displayed above it, making trends easy to read. The shaded area under the line highlights periods of higher activity.
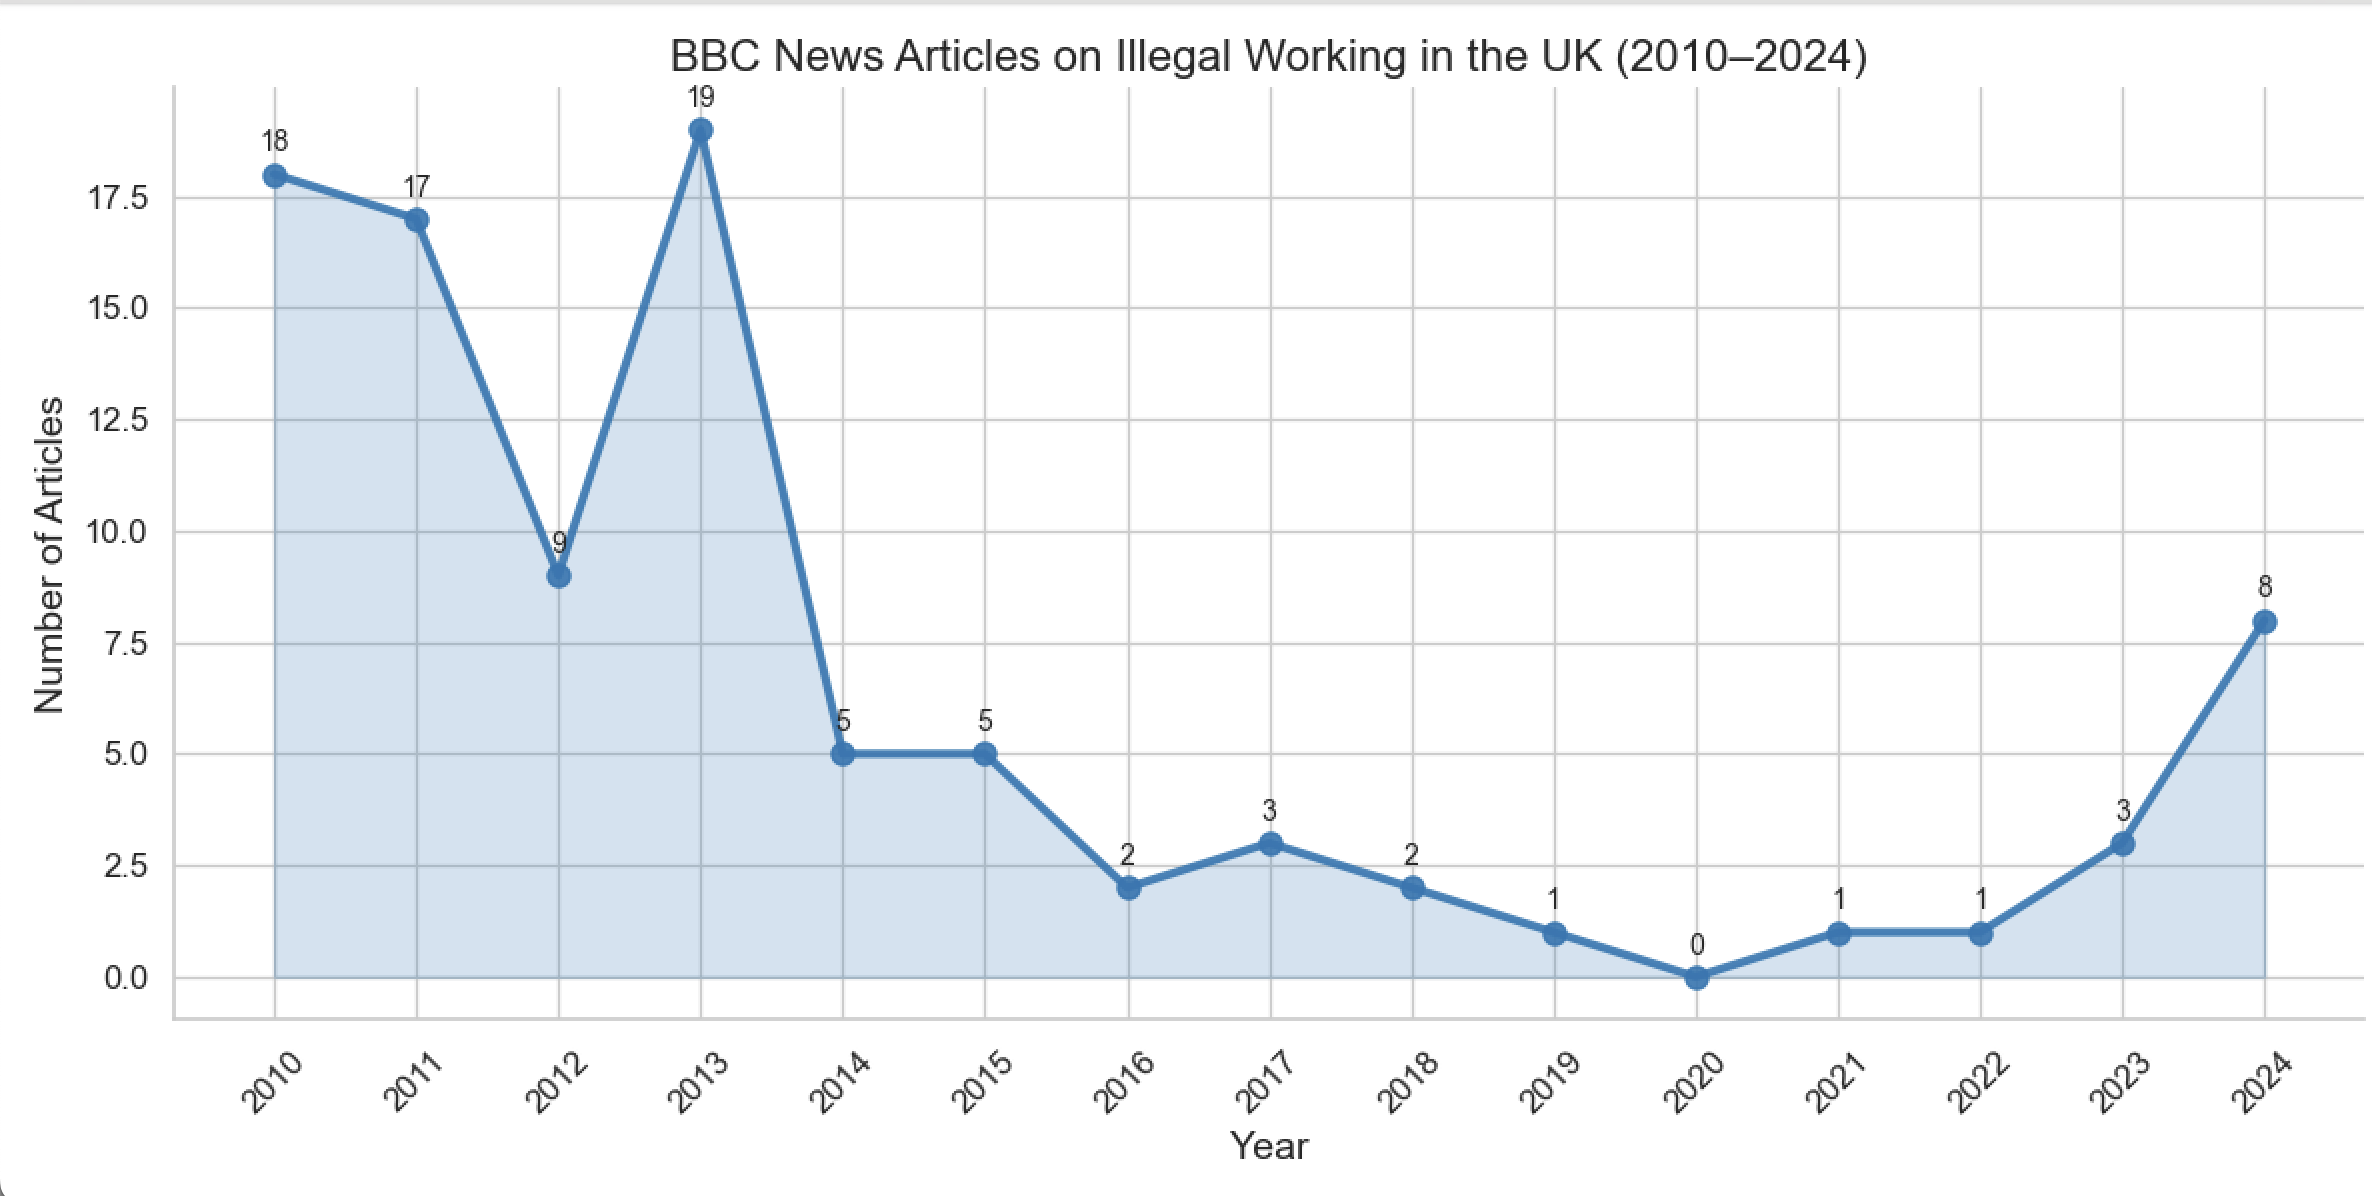
The graph reveals fluctuations over time, with certain years showing noticeable peaks in coverage and some years having few or no articles. This visualization clearly illustrates how media attention on illegal working has changed over the last decade, providing a quick and intuitive understanding of trends and patterns.
Reflection on the Entire Project.
This mini-project was engaging and consistently challenged me to learn and develop new skills. It provided an opportunity to enhance my ability to work with AI and to understand the many ways textual data can be analysed. Before undertaking this project, I had not anticipated being able to transform textual information into visual representations. My skills in digital humanities improved significantly as a result of this work. Including this aspect in my thesis will make a substantial contribution, as compiling a large corpus and applying digital humanities methods greatly increased the efficiency and depth of the analysis. However, I understand there place for improvement for instance my the choropleth map currently has no labels, although data is displayed when hovering over each region; adding labels would improve readability and interpretability. Some locations are not mapped accurately, reflecting limitations in matching BBC geographic references to available administrative GeoJSON data.